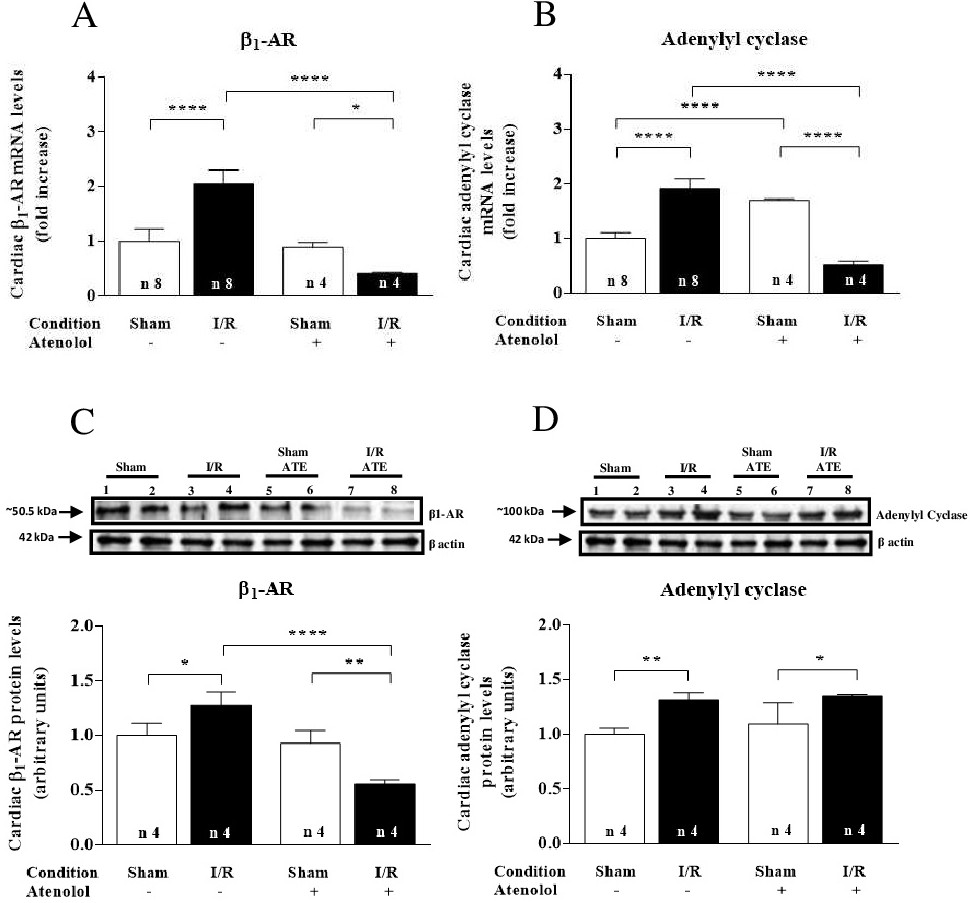
Fig. 4. Cardiac levels of b1-adrenoreceptors and adenylyl cyclase (mRNA expression and protein abundance) after renal I/R. Data are expressed as mean ± SD. The number of experiments using different preparations is indicated within each bar. Mice from the Sham (empty bars) and the I/R (filled bars) groups were treated with or without atenolol, as indicated on the abscissae. (A) β1-AR mRNA. (B) Adenylyl cyclase mRNA. (C) β1-AR protein abundance. Upper panel: Representative immunodetection for β1-AR and β-actin as control for protein loading. ATE: Treatment with atenolol. Lower panel: Graphical representation. (D) Adenylyl cyclase protein abundance. Upper panel: Representative immunodetection and β-actin as control for protein loading. Lower panel: Graphical representation. Differences were assessed using one-factor ANOVA followed by Bonferroni's test for selected pairs. *p<0.05, **p<0.01, ****p<0.0001.